Abstract: Interaction analysis transforms everyday interactions into rich empirical evidence, revealing hidden patterns in how people communicate, collaborate, and organize their activities. Yet, its analytical processes can be slow and difficult to share. LEGO Serious Play offers an exciting alternative: turning research findings into tangible, metaphorical models that researchers can build, dismantle, and reinterpret together. By thinking with their hands, researchers can uncover tacit knowledge, discover unexpected connections, formulate theoretical insights, and translate complex experiences into research questions, diagrams, and academic writing.
This lecture was recorded in the Fall 2024 Graduate Seminar of the University of Florida’s MXD MFA course.
Audio
Full transcript
The purpose of this presentation is to introduce the idea of using LEGO-based activities for interaction analysis. This method was developed by Brigitte Jordan and Austin Henderson (1995) while they were working at the Xerox PARC Center, a very interesting laboratory that, from the 1970s until the end of the 1990s, developed many new user-centered design technologies, such as Ethernet (computer networking), and the graphical user interface later popularized by Apple, among many other things. They were pioneers in employing anthropologists within both technology and design teams. Although the method was developed by these authors, who had backgrounds in anthropology, it also draws on conversation analysis, ethnomethodology, and other qualitative methods, essentially simplifying and combining them.
The goal of interaction analysis is to describe interactions between people and/or objects within the environments in which they take place. Its purpose is to develop an advanced interpretation of commonplace phenomena that few people pay attention to and to generate insights into emerging phenomena in situations of uncertainty. One of the most cited studies based on interaction analysis concerns air traffic controllers (Suchman, 1996). This study identified and explained why certain accidents were happening as a result of poor user interface design. The interfaces were so cluttered, and displayed different warnings at different moments, that controllers could not identify in time how to prevent collisions between airplanes. This was a key piece of research demonstrating the return on investment in this kind of field study.
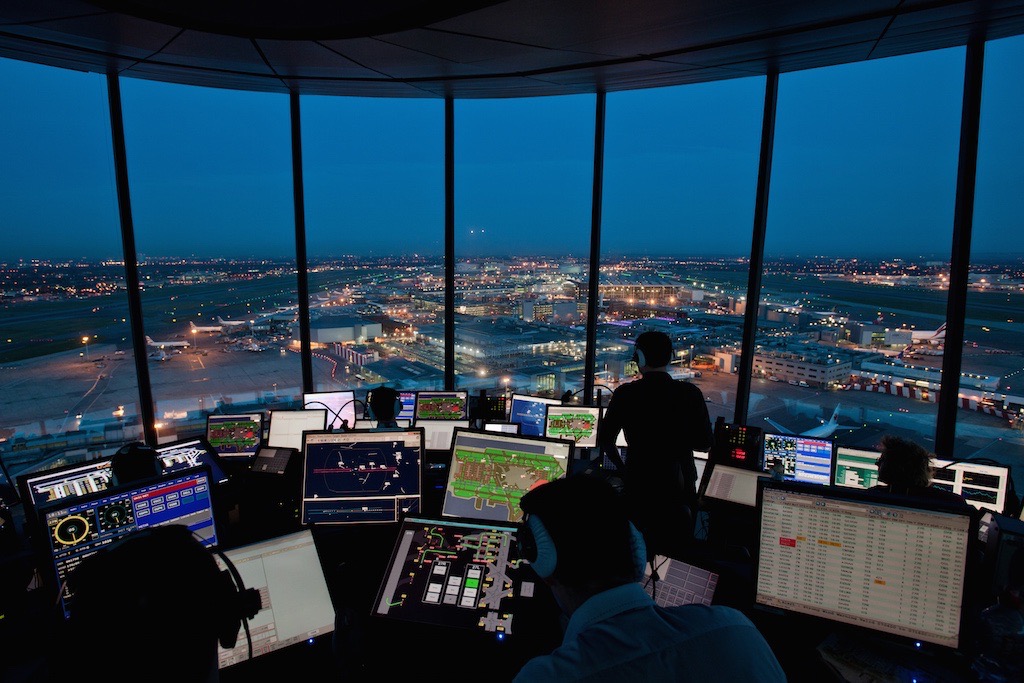
The source of rigor in interaction analysis comes from transforming lived experience into data that can be brought into another context, allowing people to understand what it is like to be an air traffic controller without actually being one. Another aspect is that part of the researcher’s bias can be delegated to the technical apparatus, such as video cameras fixed in a particular location. In our own experience last week, we had two cameras. You probably noticed the differences between the footage from the camera I was holding in my hand and the one that was fixed in place. These are two different ways of looking at the same situation, producing two different interpretations of it. However, because we have these more objective ways of measuring my own perspective, we can also scrutinize my biases. We try to generate interpretations through multiple ways of visualizing the data, challenging the theory rather than simply confirming it.
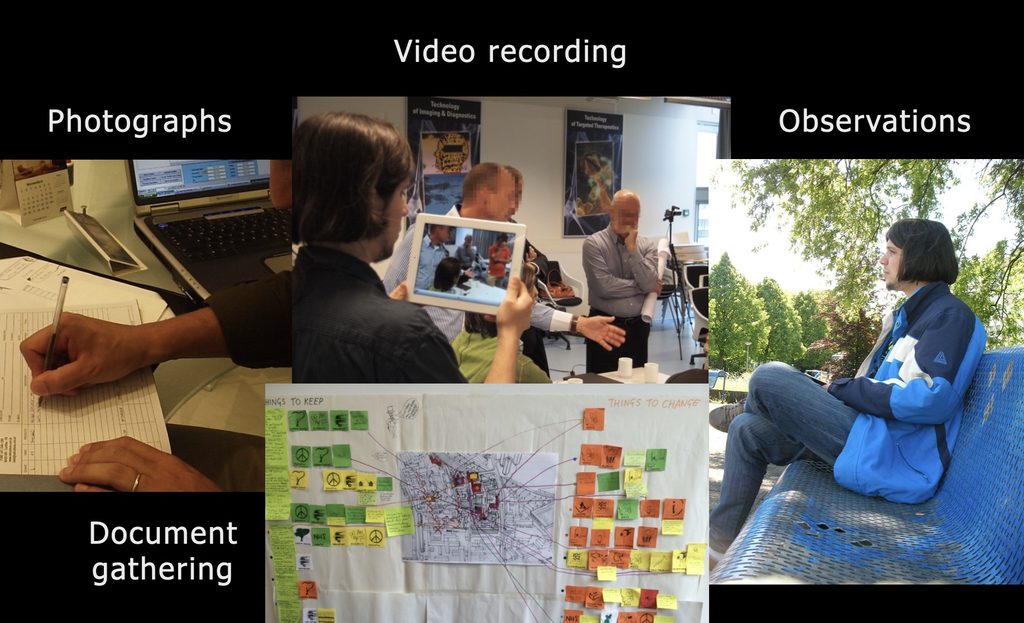
This can be done in many different ways, such as taking photographs, recording video, and observing. You do not necessarily need to record anything to conduct interaction analysis. However, having such data is useful because you can return to that layer of evidence and develop new interpretations and new ways of looking at the situation. You may also want to share or store documents by photographing them or keeping physical copies. During my PhD studies, I applied these methods in several situations, but I would like to draw attention to one particular example in which I spent an entire day simply watching people in a public park. My colleagues from Engineering asked me whether I was really doing research, since it looked as though I was just sitting around and doing nothing. In fact, I was taking notes about the people passing by, including what the older women were doing and where they were throwing their trash. This was part of a project investigating the park’s environmental conditions as a basis for developing proposals to improve it.
The second part of the process, after collecting the data, is analyzing it. You can actually analyze while observing, which is what I was doing through note-taking. This meant that I did not need to watch eight hours of recordings afterward, which would have been very time-consuming. Instead, I could go directly to my notes and check only the recorded parts that are needed to revise. After watching the recordings, I typically take additional notes. Analysis can be conducted individually or in groups, which is something we are going to try today. It is also useful to have everything transcribed.
An important development is automated transcription, which has only recently become feasible through tools such as Whisper AI. I installed it on my computer, and now I can transcribe recordings that are one or two hours long. We now have subtitles for our videos, as well as text files that we can use to compile tables such as this one. This particular table was compiled by Rafaela to analyze the study on monster aesthetics (Angelon & Van Amstel, 2021). There are also very complex qualitative data analysis software packages that can be used to code data, although they are probably unnecessary for your projects here. You will most likely use something simpler, such as sorting and grouping Post-it notes. This is somewhat similar to the exercise we have just done earlier in this class, but I would say that it demonstrates why you should have used Post-it notes in the first place rather than a whiteboard. The whiteboard was not the best material for that kind of co-design activity because it is always useful in qualitative data analysis to have something that can be modularized and moved around. You probably need Post-it notes, but not the small ones, because the texts being produced are larger than what can fit on them. Larger Post-it notes or attaching a piece of tape to a sheet of paper works best for this task.

Once you have all the data at hand, you need to define what you are going to focus on in your analysis and code the evidence. Coding means applying a particular category to a portion of your data that is similar to another portion, identifying commonalities. Typical analytical focuses include event structures; the temporal and spatial organization of activities; conversational shifts, including changes in who is speaking; participation structures, such as who is directing the discussion and who is being democratic; and the encoding and recovery of information. This last aspect concerns how people codify their ideas into particular symbols or acronyms, as well as the artifacts and documents they use to make their work feasible.
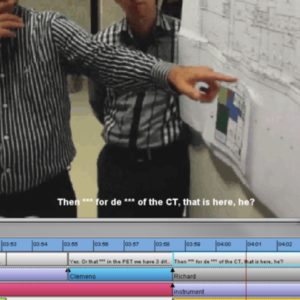
I would like to show a quick example of how I used interaction analysis in my own PhD research. I recorded design activities in a hospital context, where architects, managers, and mathematicians were discussing how people would work in a future healthcare facility. Where would the patients go? How would nurses take care of them? In what order? What kind of work processes would they follow? I recorded these activities and transcribed them. Since the participants were speaking Dutch, I had to learn Dutch in order to transcribe the recordings and, later, to interview people in the language. At that time, automated transcription tools such as Whisper were not available, so learning Dutch and reaching the necessary level took me several years. I then imported the material into a video annotation tool called Anvil, which allowed me to display subtitles on one line alongside tags synchronized with the video timeline. These tags indicated who was speaking at each moment and represented the interactions analyzed according to the theoretical framework I was interested in.

After completing this work, a colleague of mine, Vedran Zerjav, became interested in collaborating on the data. He was doing his postdoctoral research at the University of Twente, where I was doing my PhD, and he was interested in studying leadership. I was not particularly interested in leadership, but I already had the data and wanted to publish with a more experienced academic. We joined forces and published a paper (Zerjav et al, 2014) analyzing that particular workshop through interaction analysis, using Anvil’s ability to export transition-shift diagrams.
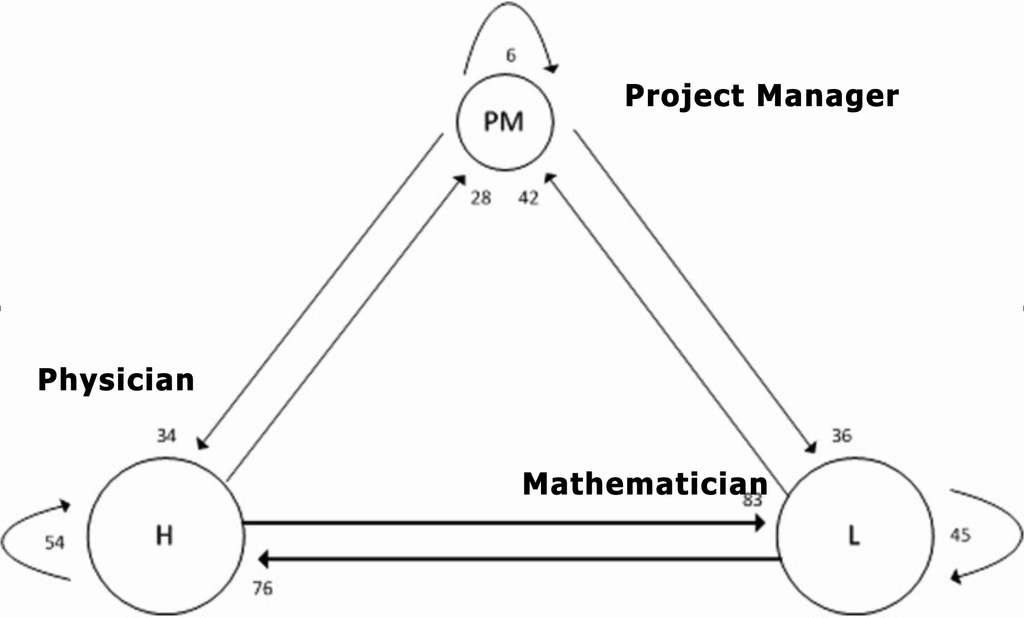
Three people were essentially interacting in this workshop: the project manager, the physician, and the mathematician. You might assume that the project manager, as the leader of the project, would speak more than the others during the meeting. However, the size of his bubble was smaller, indicating that he had fewer speaking turns. Most of the speaking was done by either the physician or the mathematician. Interestingly, by examining the data carefully, we discovered that whenever the physician said something, there was an 83 percent chance that the mathematician would speak next. This meant that the mathematician tended to interpret or further analyze what the physician had said, while the physician also responded to the mathematician’s contributions. In this way, they joined forces to challenge some of the project manager’s ideas.
The findings become even more striking when we examine how these numbers changed over time. The diagram shows the number of speaking turns each participant had throughout the workshop, which lasted approximately one hour. The project manager was mostly listening at the beginning, reacting with expressions such as “Okay,” “All right,” “What do you think?” and “Is this true?” He did not say much, but toward the end, when he had to wrap everything up, he began speaking considerably more. The physician and the mathematician led most of the conversation, and their relative participation shifted over time. At the beginning, the mathematician was more active, while later the physician became more active. Yet, the project manager wrapped up the conversation with some level of agreement. The main finding of this research was that leadership is not achieved simply by holding an official position above other people. Leadership is achieved through actually talking to people and ensuring that they trust you. That is difficult to accomplish.
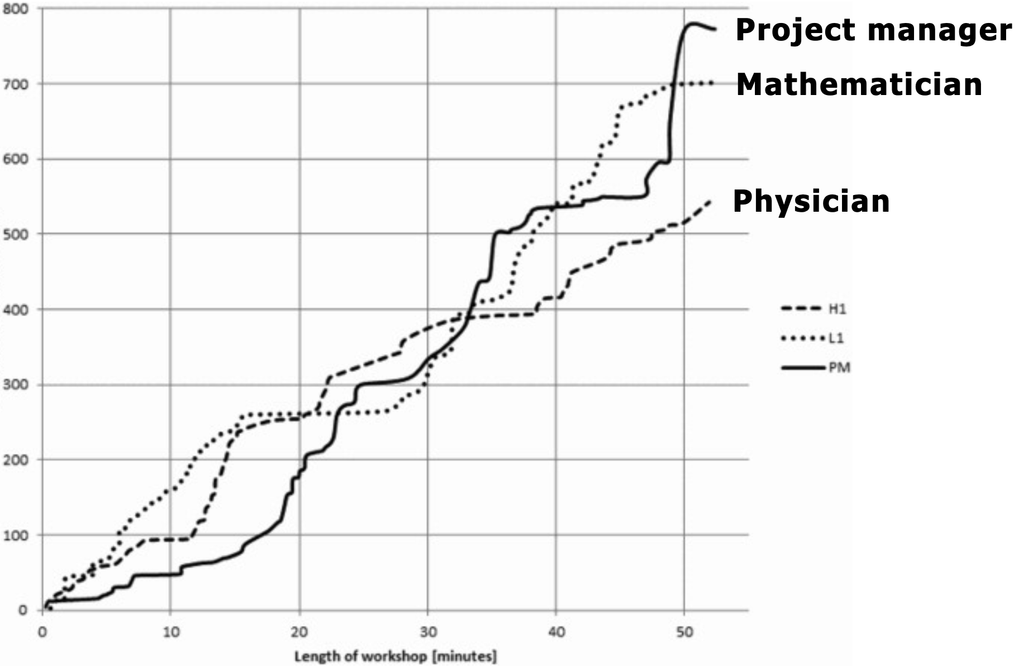
This research was not particularly connected to my own research program, though. Vedran continued investigating that topic throughout his career, and he is now working on the design of large megastructure projects, while I moved in another direction. Nevertheless, we collaborated at that particular moment. This is how scientific collaboration works: we cross paths and take opportunities to collaborate. Later on, we may or may not return to them.
Interaction analysis is a great method, but it is time-consuming and can be very tedious. It requires a lot of time and provides a strong empirical foundation, but it also curtails theoretical concept formation. It is difficult to come up with a new theory using this method. It is also difficult to have multiple researchers analyzing the data simultaneously because each researcher has their own access point to the data, and you cannot manipulate the data at the same time unless you have a tool that allows this. Such a tool does not exist yet. This might become possible in the future, but currently there is nothing that can do it, unless you do it physically using LEGO Serious Play. That is the potential idea I want to experiment with you.
Building metaphorical models enables intuitive formation of theoretical concepts. How can you explain something that happened in our previous workshop? You might try answering that question using LEGO. Thinking with your hands helps you deal with progressively abstract methods, as you have already experienced with LEGO Serious Play. It also consistently produces something meaningful that provides an overview of what is going on. This enables real-time research collaboration, with many people working together to build things. Last but not least, it allows us to have fun while doing productive work.
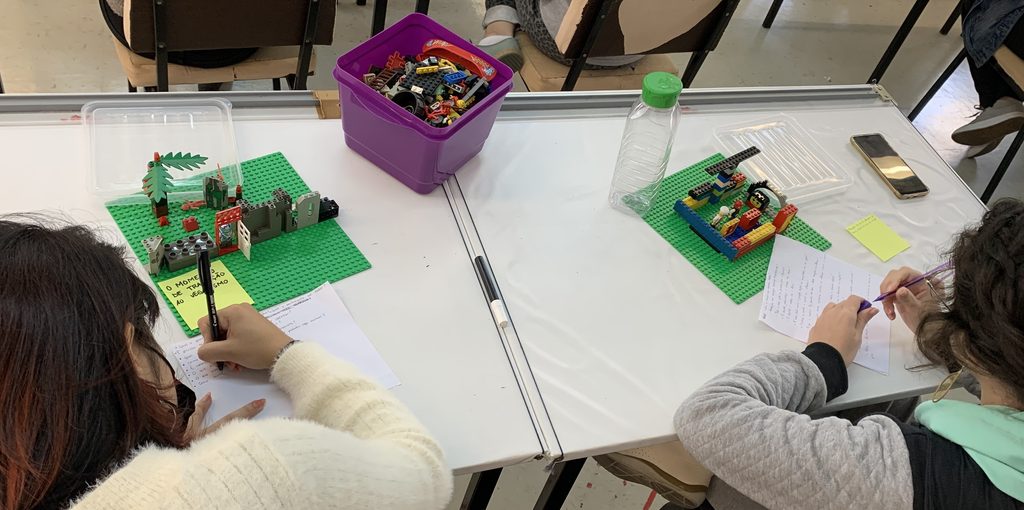
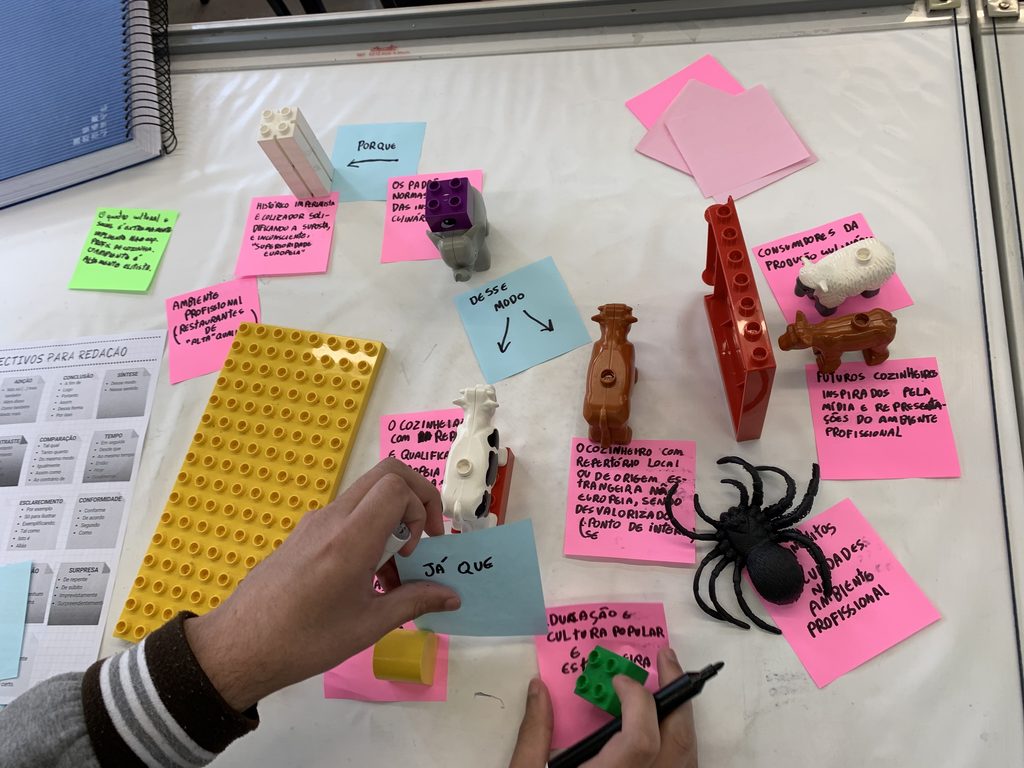
I would like to present a couple of examples from my previous work. In one project, design students at UTFPR used LEGO Serious Play to develop inspiration for defining their fieldwork research questions. Before going into the field, you would have to create a LEGO Serious Play model to formulate questions and establish a good research guideline. This would allow you to enter the field already knowing that there was something specific you wanted to investigate. After returning from the field, I also asked students to build a metaphorical model representing everything they had discovered, or at least their most important discovery. After building the model, they would dismantle it into pieces and write specific research cards containing the most important insights associated with each part of the discovery. In this way, they gradually learned how to write a paper through this making activity, which is something designers can easily grasp. It is much easier for them than actually writing and expressing everything through verbal or written language.
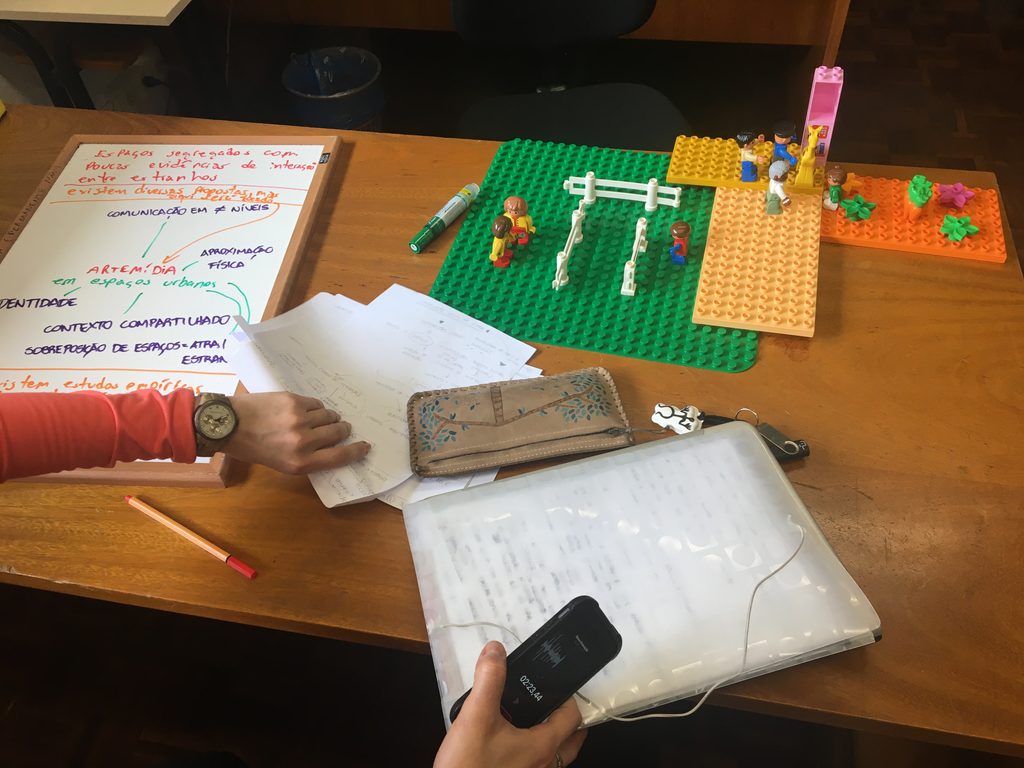
A second example comes from a master’s student from PUCPR, Luíza Chiarelli de Almeida Barbosa (2019), who was struggling at a particular point in her research. She had returned from Berlin after visiting the Transmediale exhibition and was very excited about the experience, but she could not articulate anything scientifically about it. She could only say that it was cool. However, she had spent almost a month there observing how the festival was organized, how it affected the city, and other aspects of the experience. I helped her find words for all this tacit knowledge using LEGO Serious Play. After unlocking the knowledge she already possessed but did not know she had, she became much better prepared to articulate her findings in writing. We then worked with whiteboards. Those mobile whiteboards are very useful, and we might also want to get some of them for this space.
The last example involves a more in-depth use of LEGO Serious Play. Elias Harmuch-Neto (2020) was studying the development and life trajectories of people who were both developers and designers: software developers who could write code and also create visual identities. These people exist, and I have worked with them through the Apple Developer Academy project. Elias wanted to understand what had happened throughout their lives to make them interested in both activities. After interviewing them, he could not identify what was common across their trajectories. We then built a LEGO Serious Play model, through which he discovered that, at some point, these individuals had developed an interest that gradually became something they enjoyed and consolidated. They eventually attended university, but found that the university was hampering their studies. At some point, they managed to escape the university environment and pursue their own activities independently.
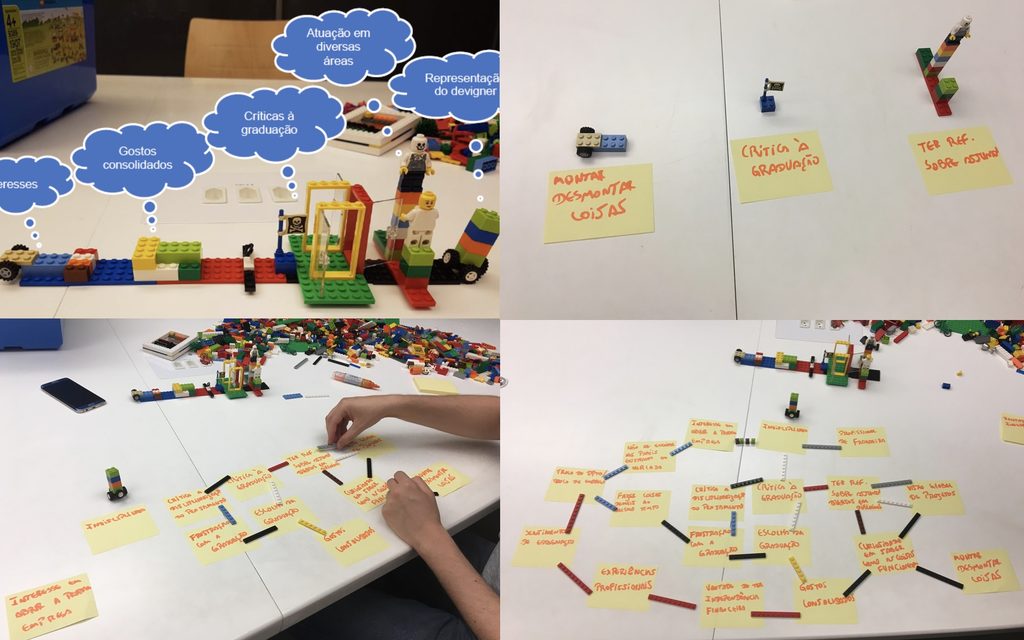
After building this large model, which contained many vague ideas, he began breaking it down and creating a diagram to deepen his understanding of each of its parts. He continued dismantling the larger picture and reassembling it, allowing him to work with both perspectives: the individual elements and the overall picture.
These are not examples of using LEGO Serious Play for interaction analysis; however, we will now use some of these modeling practices to analyze a video recording from a previous class. Let’s see what happens.
References
Jordan, B., & Henderson, A. (1995). Interaction analysis: Foundations and practice. The journal of the learning sciences, 4(1), 39-103. https://doi.org/10.1207/s15327809jls0401_2
Zerjav, V., Hartmann, T., & van Amstel, F. M. (2014). A leadership-as-practice perspective on design in architecture, engineering and construction projects: interaction analysis of a collaborative workshop. Engineering Project Organization Journal, 4(4), 1-13. DOI: http://dx.doi.org/10.1080/21573727.2014.970177
Suchman, L. (1997). Centers of coordination: A case and some themes. In Discourse, tools and reasoning: Essays on situated cognition (pp. 41-62). Berlin, Heidelberg: Springer Berlin Heidelberg. https://www.lancaster.ac.uk/fass/doc_library/sociology/Suchman_Centers_1997.pdf
Harmuch Neto, Elias; van Amstel, Frederick M.C.; Binder, Fabio; Reinehr, Sheila dos Santos; Malucelli, Andreia. (2020). Trajectory and traits of devigners: a qualitative study about transdisciplinarity in a software studio. In: Proceeding of the Conference on Software Engineering Education and Training (CSEE&T), Munich. 10.1109/CSEET49119.2020.9206180
Chiarelli de Almeida Barbosa, Luíza. (2019). UMA ANÁLISE DE INTERAÇÕES SOCIOESPACIAIS URBANAS: FESTIVAL DE ARTEMÍDIA TRANSMEDIALE’18, BERLIM. Master thesis. PUCPR.