The World Usability Day was for the first time organized here at the University of Twente. In this event, I shared a practical output of my PhD research: a method to gather user data using low-tech materials. The method consists of collecting data through low-tech visualization and using the data to build high-tech visualizations, following a similar visual pattern.

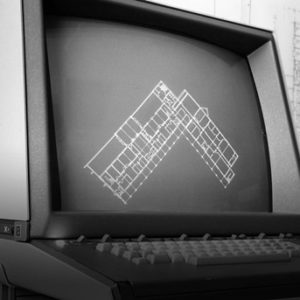
Here there is an example. The picture bellow show how we gather user data about the walking paths of nurses and patients inside the medical imaging center. There is more detail about the knitting game in another post.

The data was brought to a high-tech visualization (free download here) and we invited design students to play around with that. The animation bellow shows the evolution of a designer’s work based on the walking paths. You can see that the reason why the designer changes the rooms, the doors and the corridors is related to the evidence collected through the low-tech method.

The VISICO low-tech toolbox
For the workshop in the World Usability Day I took the method to a next level; I assembled a toolbox to create these kind of visualizations. The toolbox is named The Low-tech VISICO, after the high-tech visualization center where I work. The box is an authentic construction equipment container, but filled with office supply, stationery, and a bunch of arts and crafts.

The workshop task was to reverse engineering a high-visualization using the toolbox. The participants had to select one example from my high-tech visualization pool and create the means to gather the data from the users. The low-tech visualization did not need to follow the same visual pattern, but it had to generate the same data
.
Visualizing project stakeholders
Here are some examples of participant’s work. The Stakeholder Circle is a useful software to visualize the influence and power of stakeholders associated with a project.

The software is nice, but how do you get the data to fill-in? Anybody willing to make an accurate representation will have to talk to the stakeholders and check what are they up to. The low-tech method jumps in at this phase.
In the picture below, the cute monsters are the stakeholders, the money is their wealth contribution, the disc underneath is the range of influence, and the distance to the central bubble represents the interest in the project. The resulting image seems childish, but there is so much information packed into it!

Visualizing my daily routine
Modemapping is a technique developed by Stuart Karten to represent the different kinds of moods a person goes through along the day. This can be used to design products that are responsive to these moods.

Very nice, but again, how do you get such detailed information from users without inventing anything? You need an interface for that, a low-tech interface. See how the workshop participants solved this issue in such a simple way.

Visualizing web analytics
Goolgle Analytics is used to track website visitors and display relevant statistics to their owners. There is one particular visualization that shows the flow of people around the website, highlighting the pathways left behind.

This was translated into a new method of inquiry in which the website visitor explains the reason why he is going to one or another information. This is like a sequential card-sorting, so to speak.

Recommendations
My recommendations for those who want to build low-tech visualizations are:
- Develop a consistent data gathering framework. Different users should basically follow the same steps so you can compare their input easily in the high-tech version.
- Design simple rules so anybody can understand.
- Offer moderate flexibility for representation. Not to the point consistency would suffer; not to little to the point people would not feel at ease to express something else that you do not ask but they find relevant to say.
- Let users take control of what they are representing.
Here follows my slides from the workshop. A conference paper will be published next year about the method.