Data visualization
-
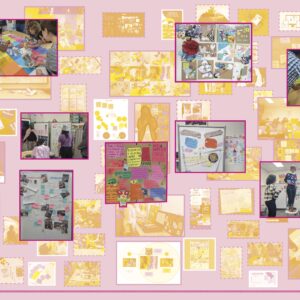
Codesigning Diversity Alter/natively (2025)
As a Vietnamese immigrant student, Hien Phan wanted to dedicate her project-in-lieu-of-a-thesis to the Asian and Pacific Islander students of the University of Florida. Building on the codesign practice of the Master of Fine Arts in Design and Visual Communications (MXD) program, she wanted to codesign a more welcoming academic environment for future students like her. […] - May 25, 2025 -
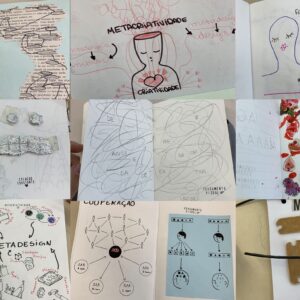 Abstract: This lecture explores the expansive power of visual thinking as a tool for design research, problem-solving, and knowledge creation. Moving beyond common sense definitions of visual thinking, it focuses on how images try to capture partially known contradictions in codesign, moving the design process forward into changing reality. Lecture recorded in the Fall 2024 […] - Sep 6, 2024
 -
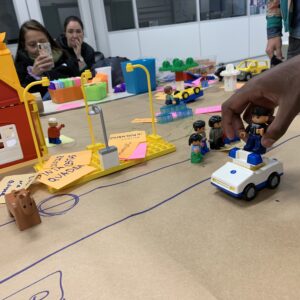
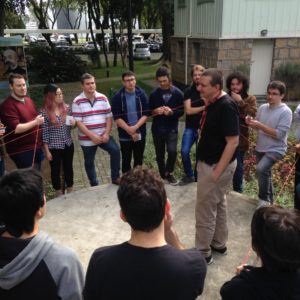
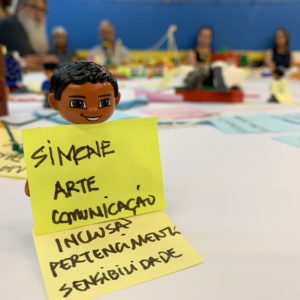
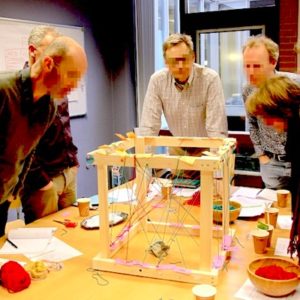
Community Design with Lego Serious Play
Every community practices the design of itself, as Arturo Escobar has pointed out in his book Designs for the Pluriverse. How can this metadesign process be more creative, imaginative, and conscious? Lego Serious Play can support Community Design in a few ways: materialize abstract values that a community wants to express, map community assets, anchor […] - Jul 20, 2024 -
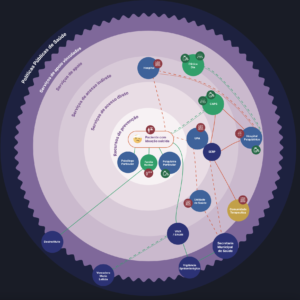
Service integration for suicide prevention (2022)
Service integration for suicide prevention is the final work of Barbra Eliza da Silva in her Graphic Design degree at UTFPR. Barbra heard from some friends who work in mental health services that the number of suicide attempts was skyrocketing in Curitiba. She decided to put her final work to help. The project aimed at facilitating […] - Dec 7, 2022 -
 Reaction to computer-mediated oppression can be rehearsed in a Theater of the Techno-Oppressed session. When using the image theater technique, it is possible to capture every attempt to react to oppression and compare their efficacy in still photos. In addition to the spect-actors who stage the play, two persons are required: a photographer and a […] - Mar 27, 2022
 -
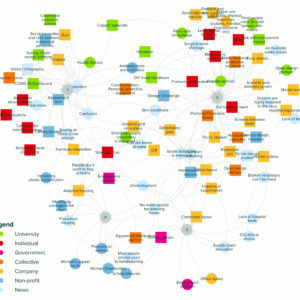
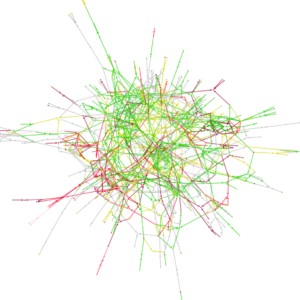
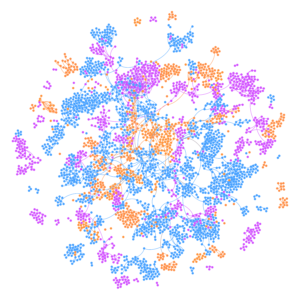
 Graphs are mathematical structures that relate a sequence of entities that share an abstract connection between them. The connections are expressed through edges (links) that connect the related entities (nodes). Graphs are mostly used to find similar entities of different kinds through common linking patterns. Graph visualization is a common technique employed by social network […] - Feb 2, 2022
 -
Conservatism in Digital Trends: Findings from a differentialist analysis of influence graphs
Van Amstel, Frederivan Amstel, F. M. C. (2021). Conservatism in Digital Trends: Findings from a differentialist analysis of influence graphs. InfoDesign – Revista Brasileira De Design Da Informação, 18(2), 37-52. https://doi.org/10.51358/id.v18i2.933 - Jul 31, 2021 -
Prospecting a systemic design space for pandemic responses
Van Amstel, Frederick M.C.; Guimarães, Cayley; Botter, Fernanda. (2021). Prospecting a systemic design space for pandemic responses. Strategic Design Research Journal, 14(1), pp.66-80. DOI: https://doi.org/10.4013/sdrj.2021.141.06 - Mar 22, 2021 -
 Visual oxymoron is a graphic representation of a contradiction codesigned by those who face that contradiction in everyday life. In written language, an oxymoron is a figure of language that displays interconnected opposing ideas. A visual oxymoron displays the opposite forces of a contradiction in a single image. The representation can be made through visual […] - Jan 27, 2021
 -
 Germ cell model is a representation of a contradiction that is at the forefront of activity development. It features the dialectical reason why development is not advancing further as expected, and a possible path to overcome the barriers. Models are rather ambivalent in the way they represent contradictions, since they may not solve the contradiction. There […] - Jan 27, 2021
 -
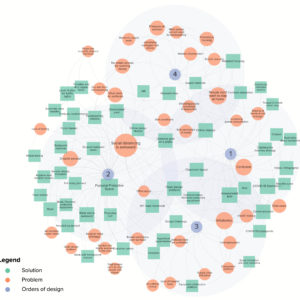
Controversial design space mapping
Design space mapping is widely used in cognition studies to trace ideation activity through a series of mental states. Controversial design space mapping expands this method with the friction generated by the clash of ideas coming from different minds. Each idea is classified as a problem (dark circle) or a solution (white square). A color […] - Jan 2, 2021 -
 New business generates value through a provisional network of relations, including strategic partners, suppliers, and clients. Young entrepreneurs take time to understand that starting up a company does not depend on themselves only. Value-net is a strategic framework created by Cinzia Parolini (1999) to understand and manage the network of relationships within a business ecosystem. […] - May 18, 2020
 -
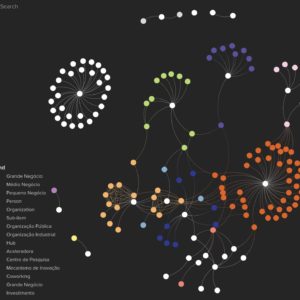
Open innovation ecosystem development
This research aims at articulating the participation of Bosch in the entrepreneurial ecosystem of Curitiba city, Vale do Pinhão. Firstly, the current connections and partnerships with startups will be mapped, in particular, the Curitiba Connectory initiative. Second, these relationships will be evaluated based on the Open Innovation practices carried out by other actors of similar […] - Mar 22, 2020 -
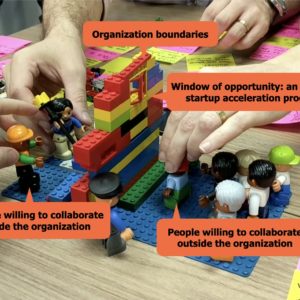
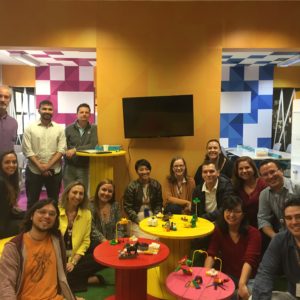
 The Industrial Design Academic Department (DADIN) at UTFPR wanted to strengthen faculty collaboration in outreach activities. Then, it organized a workshop facilitated by faculty members Frederick van Amstel, Marco Mazarotto, and Eunice Liu. The workshop mapped current and future outreach activities from faculty members using an adapted version of Lego Serious Play. Each faculty chose […] - Feb 26, 2020
 -
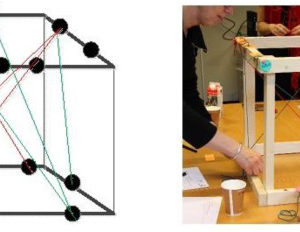
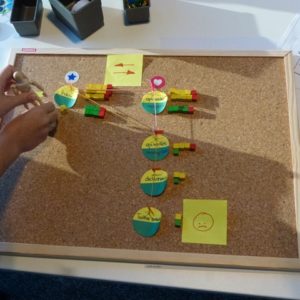
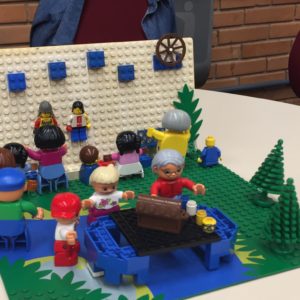 The Experience Map is an abstract representation which might not be understood by stakeholders who are responsible for shaping that experience. Since their participation is essential to stage the experience, I developed a Tangible Experience Model with uses Lego pieces to represent the relationships between people, things, spaces, and activities. Since the model’s meaning relies […] - Nov 4, 2018
 -
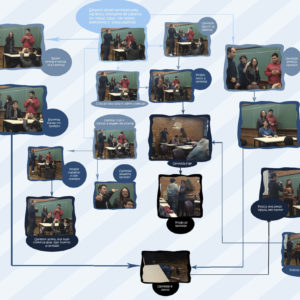
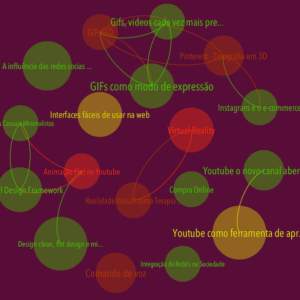
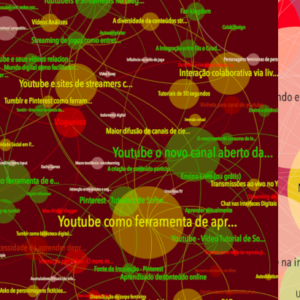
Digital Trends Observatory (2015-2017)
Regular course – 40hs – Digital Design Bachelor – Catholic University of Paraná This course helps students find a relevant topic for their final graduation work. They learn how to deal with trends and are tasked with identifying today’s digital design trends. In the Digital Design Trends Laboratory course, my students were requested to identify […] - Oct 31, 2018 -
Organizational Learning in Open Innovation Ecossystems
Open Innovation inspires big companies to participate in entrepreneurial ecosystems, in the hope of promoting valuable organizational learning. Individual employees can learn together with individual entrepreneurs who are struggling to find a working business model, however, this learning might not be absorbed by the company. One of the reasons for that is the lack of […] - Oct 30, 2018 -
Making dilemmas explicit through the use of a cognitive mapping collaboration tool
Castaño, J. M., van Amstel, F., Hartmann, T., & Dewulf, G. (2017). Making dilemmas explicit through the use of a cognitive mapping collaboration tool. Futures, 87, p. 37–49. https://doi.org/10.1016/j.futures.2017.01.006 - Feb 20, 2017 -
The social production of design space
Van Amstel, F.M.C; Hartmann, T; Voort, M. van der and Dewulf, G.P.M.R. The social production of design space, Design Studies, 46, 2016, p. 199–225. DOI: https://doi.org/10.1016/j.destud.2016.06.002 - May 2, 2016 -
 The Expansive Design thesis relies on a historical analysis method supported by an IBIS with graphical maps (Compendium). The graphical maps used for data collection and analysis are available online. Some parts of the maps are not included to preserve the identity of the participants and the organizations involved. Alternatively, you can download the research data [ZIP] and […] - Feb 15, 2016
 -
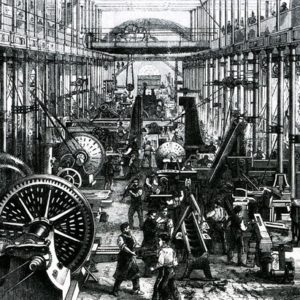
The spatialization of workflow
At the beginning of the industrial revolution, workspaces were scattered over factory plans in no rational order. They naturally emerged around stationary large products, machines, and tool sets. The rise of the assembly line brought a new strategy for factory space: the spatialization of the workflow, i.e. to ascribe tasks to certain spaces and to […] - Mar 25, 2015 -
Flood protection area planning (2015)
Grebbedijk is a flood protection complex around Wageningen and Utrecht, The Netherlands. The stakeholders are considering adding extra functions to the area in order to generate more economic activity and nature-oriented leisure. The project is facing dilemmas because the available strategies present both advantageous and disadvantageous effects. For example, enlarging the harbor is deemed to […] - Mar 25, 2015 -

The contraction of design representations
In the last post, I described the expansion of the design object in the last centuries. This process is followed by another historical change in the opposite direction. Instead of expanding together with the object, the design representations are becoming smaller and more precise. The representations are being contracted in the hopes of corralling the […] - Mar 12, 2015 -
Low-tech to high-tech visualization
The World Usability Day was for the first time organized here at the University of Twente. In this event, I shared a practical output of my PhD research: a method to gather user data using low-tech materials. The method consists of collecting data through low-tech visualization and using the data to build high-tech visualizations, following […] - Nov 25, 2014 -
Expanding the representation of user activities
Van Amstel, F. M.C., Zerjav, V., Hartmann, T., van der Voort, M. C., & Dewulf, G. P. (2015). Expanding the representation of user activities. Building Research & Information, 43(2), 1-16. DOI: https://doi.org/10.1080/09613218.2014.932621 - Jul 15, 2014 -
Using smartboards to enable user participation in architecture
Last week, I demoed my Walking Paths application at 3TU Innovation & Technology conference using a Smartboard that allows touch and pen interaction. To explain how it enables user participation in architecture, I presented a model of the building where the conference was held and asked visitors to draw the path they took across the […] - Dec 9, 2013 -
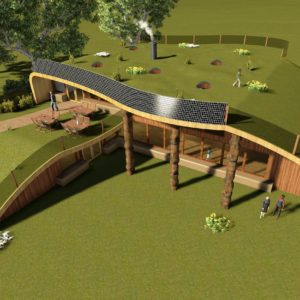
Natuurhus Almelo Nature Center (2013)
Different nature-related associations join forces to build a nature center in the middle of a small city in The Netherlands. My role in the project was to interview the stakeholders and provide a map of controversies around the project requirements. After mapping controversies, I helped them to organize a workshop where these controversies would be […] - Nov 13, 2013 -
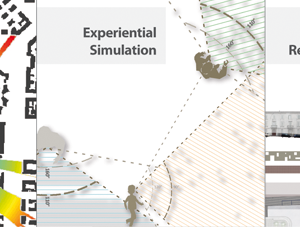
The validity of user’s activity representation
Last week I attended a conference in Milan about visualizations in Architecture. The conference showcased many objective ways to represent the user perception of space before it is built: maps, simulations, calculations, scatterplots, etc. The represented perceptions ranged from confort to privacy. My own presentation raised the issue of validity of such representations, considering the […] - Oct 7, 2013 -

Visualization Tools for Self-Representation in Healthcare Design
Van Amstel, F.M.C; Hartman, T; Van der Voort, M; Dewulf, G.P.M.R. Visualization Tools for Self-Representation in Healthcare Design. In: Morello, E., Piga, B.E.A. (eds.). (2013). Envisioning Architecture: Design, Evaluation, Communication – Proceedings of the 11th conference of the European Architectural Envisioning Association, Milano, 25-28 September 2013. Roma: Edizioni Nuova Cultura. P 507-514 - Aug 8, 2013 -
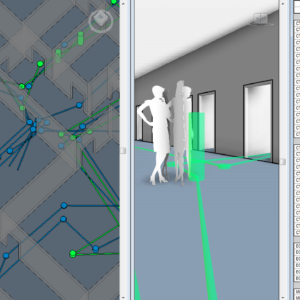
Walking paths parametric design tool (2012)
Walking Paths is an extension for Autodesk Revit, an industry standard tool for architectural design. The extension allows tracing the paths that patients, nurses, and other users should follow inside a facility. The application provides objective criteria to evaluate the work efficiency of a particular facility design. Walking_Paths [RFA] An Autodesk Revit parametric design family […] - Dec 13, 2012 -
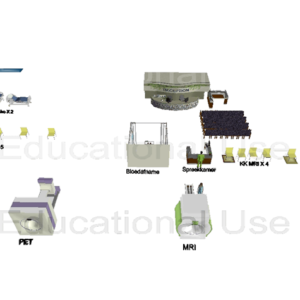
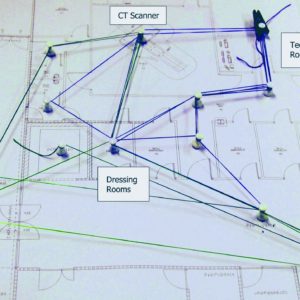
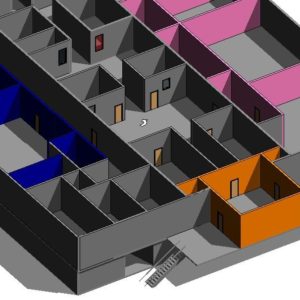
How to knit spatial layout with workflow
After realizing that the use situation is more complicated than what they thought, the managers from the CMI project organized a second user workshop to check if the current floor plan fits the workflow of scanning patients in machines such as EGG, PET-MRI, MRI, and CT. In the last workshop, a lot of time was […] - Oct 2, 2012 -
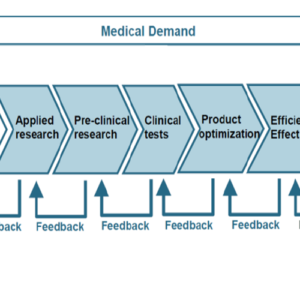
Use and design: two points of view
I’m following the CMI-NEN project in my PhD, a healthcare facility that combines research, education, and care services in one place. The project is very innovative because it links medical image research to care demand. The concept is to drive research with the actual use of diagnosing technologies, instead of just exploring what is possible […] - Jul 13, 2012 -
Medical Imaging Center (2011-2013)
The intervention had the goal of assisting practitioners to bridge the gap between the design activity and user activity in a Medical Imaging Center project, in the Netherlands. The center would have state of the art diagnosing machines based on techniques such as Magnetic Resonance Imaging (MRI), Positron Emission Tomography (PET-MRI), Computed Tomography (CT), and […] - Jun 14, 2012 -
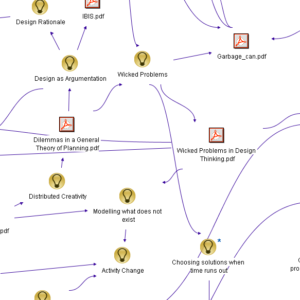
Issue-Based Information System (IBIS)
Since I started doing my PhD Research, I learnt a lot of new concepts, but I don’t like to write down everything that I find interesting during my research. I find it too boring. I prefer to rely on my memory filter; if it’s relevant, I’ll remember when needed. But, gosh, that’s not always the […] - Aug 12, 2011 -
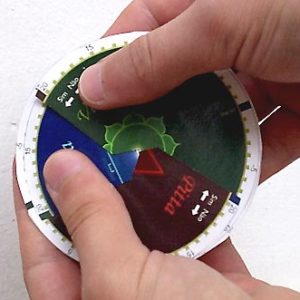 A body-composition test based on traditional Indian medicine, Ayurveda. The disc is used to mark the responses of the person to the questionnaire, giving immediate visual feedback on the predominance of one dosha over another. This was created for an Indian Restaurant in Brazil who served dishes tailored to the ayurvedic body types. An interactive […] - Nov 24, 2005