Abstract: This lecture explores the expansive power of visual thinking as a tool for design research, problem-solving, and knowledge creation. Moving beyond common sense definitions of visual thinking, it focuses on how images try to capture partially known contradictions in codesign, moving the design process forward into changing reality.
Lecture recorded in the Fall 2024 Research and Practice, MXD program, University of Florida.
Video
Audio
Full transcript
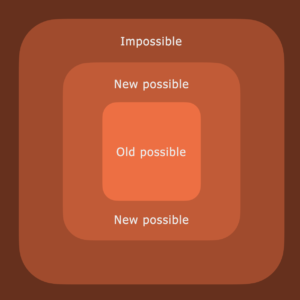
Expansive visual thinking—this is a presentation that will provide an overview of why and how producing visualities can contribute to design research, and especially new knowledge. The word “expansive” that I’m using here, drawing from my thesis, means that we are trying to expand the boundaries of our current knowledge—not just knowledge, but the world itself can expand to become wider so we understand more. As a result, our world becomes richer with more diversity, which gives us something to enjoy but also to challenge us.
First, a very simple definition of what visual thinking is. This is different from what you will find if you search for visual thinking in design research. Some people reduce visual thinking to a certain kind of drawing technique, a simple drawing style, but that’s not how I see it. Visual thinking, in general, is a way of thinking through mental, verbal, bodily, and graphic images.
You are thinking through these things or thinking with them, not thinking of them. It’s not an end in itself. Conceiving an image—like creating a graphic—is not visual thinking if you don’t have a second or ultimate purpose. So, not all graphic design falls into visual thinking, as I’m defining it here. Of course, you need to think visually to do any graphic design, but visual thinking means thinking through graphic design to conceive something beyond graphic design. You’re using it as a medium or a tool.
My first example isn’t in graphic design—it’s scientific visualization. It’s one of the most difficult visualizations humanity has ever produced. Scientists collected so much data about the universe, particularly from what we now call a black hole, and they didn’t know what it looked like. Is a black hole black? They didn’t know how it would make sense to appear to the eye, and nobody could observe a black hole with a simple microscope. You have to use several telescopes spread throughout the world. Through a highly collaborative effort, Wielgus and colleagues (2020) combined those images across almost 15 years until they got the beautiful image you just saw.
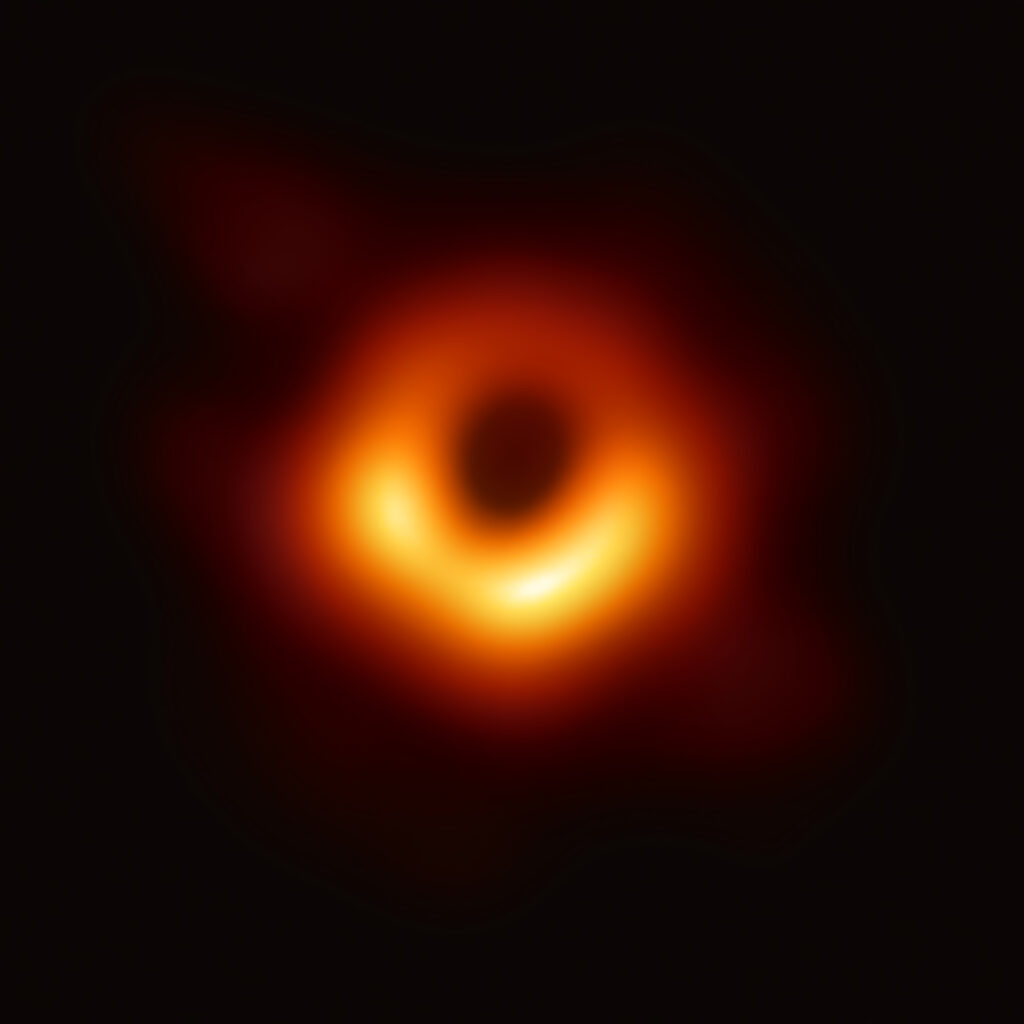
They did this because having an image of what a black hole is could spark a new generation of scientists and researchers to look at the different qualities and characteristics and define physics further. There are so many interesting characteristics about black holes. For example, what happens if you fall into a black hole? It’s impossible to fall into one because a black hole distorts time and space. Instead, if you get close to a black hole, your whole body would flatten and start spinning around it, eventually becoming the size of the black hole. It’s just crazy to conceive of because the physics completely changes there. Through those images, you can better imagine and tell such stories, right? So once you are at the event horizon, as they call it, this is when these things happen—it’s the threshold spot. Now, because we have an image, we can better conceive the craziness of what I was telling you.
Visual thinking is not the goal for scientists. They don’t want to make pretty and cool pictures like this one just for the sake of it. They want to understand better what black holes are. But they also understand and draw from art that images can represent things we don’t know or fully understand. There is some space for ambiguity and openness. And that’s why this black hole image is a little fuzzy, right? Because we don’t know so much about black holes. We might get a crisper image of a black hole in the future because we will know which kind of waves or radiation come from it, and then we can measure it. But currently, we don’t.
In the context of science, the whole purpose of visual thinking is to expand the object of research. So, what are you researching? The black hole. Expanding the object of research means I understand black holes better because my object is wider—I can encompass more of the black hole itself. So, visual thinking is a tool and a method for scientific research. But it’s also, and maybe even more so, a method and approach for design research.
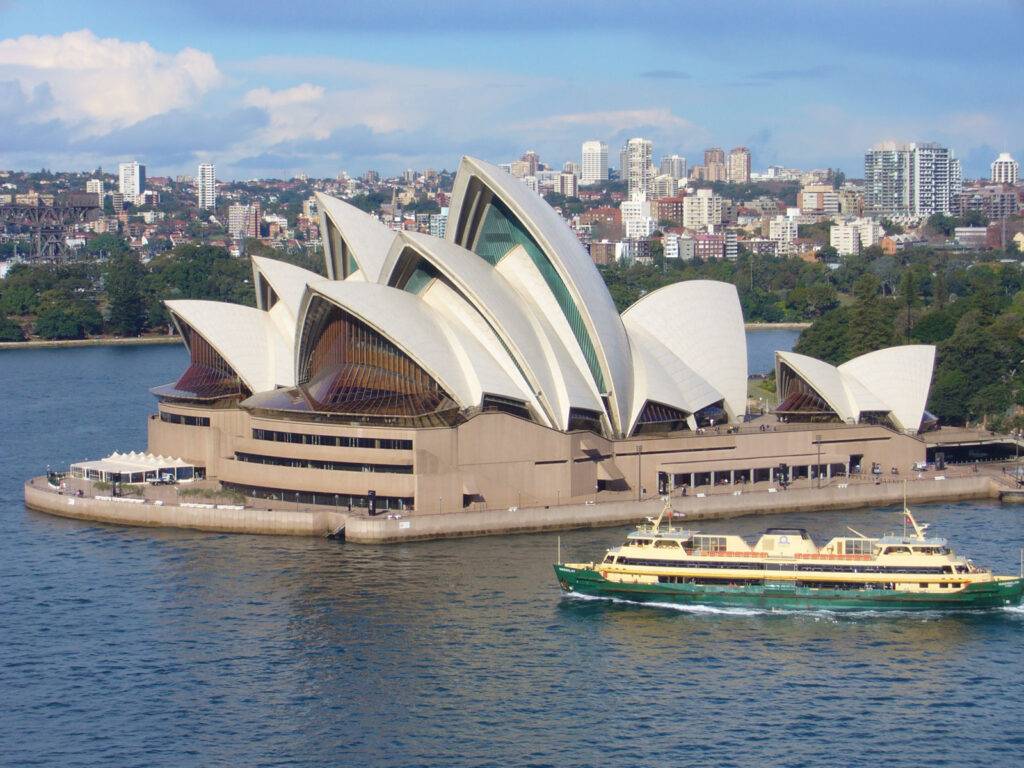
Let me give you a classic example of how design research produces knowledge in the world and how this knowledge stays in the world as a thing: the Sydney Opera House. It’s one of the wonders of the world. Architecturally speaking, building that structure in the 1960s, which is still standing up now, is marvellous because you had to understand all the characteristics of weight distribution and how to balance it according to the wind’s waves and temperature changes. All of this affects the quality of that construction. The construction defies the expected and simple way of building that would easily fit the requirements but wouldn’t look so aesthetically pleasing and challenging, nor would it change the landscape. This building is like a landmark, and many people go to Sydney to see it, especially if it is decorated for a special occasion.
So, every design object is knowledge about the world embedded in the world itself. However, visual thinking enables design research to manipulate that knowledge about the world before or after it becomes embedded into the world. It’s a layer between the object of design and the process of designing. Visual thinking is a bridge between what we know and what we don’t know.
This has been well analyzed in the book What Designers Know by Bryan Lawson (not Brian Slawson, our fellow faculty member). Bryan Lawson is a psychologist who studied design thinking and how designers think. His book is about how we produce knowledge—the peculiarities of design knowledge, also known as design epistemology or designerly ways of knowing. In the book, he discusses explicitly the Sydney Opera House as an example.
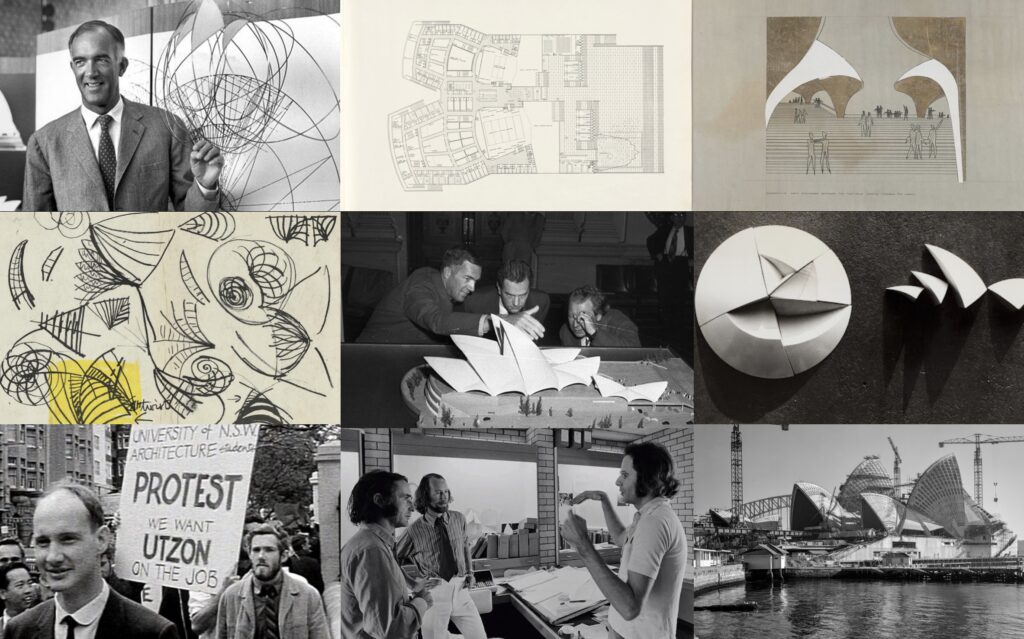
I’m bringing more pictures from the Sydney Opera House project, the process that brought that building to life. In the 1960s, John Utzon submitted his idea and his concept for this Opera House as part of a public competition. He won the competition, but many engineers and managers believed building wouldn’t be possible. It would cost too much, and City Hall cancelled the project. However, because the project was public, and the public loved it, there were protests in front of City Hall to reinstate Utzon and bring his idea to life. City Hall did not request that Utzon return to Australia to finish the project. Instead, they commissioned a new group of engineers, architects, and managers who were more focused on implementation because Utzon was bringing so many new ideas that they didn’t know if building was possible. He was heavily relying on sketches that were very stimulating to look at—fantastic—but maybe not very buildable.
As you can see in the center, there’s an image of a model, an early model that was built based on his ideas, and it was still not buildable. They had to rebuild many different models until they reached the point where the forces of nature were mastered enough that the building would not collapse. So, before the object of design is constructed, it already exists as images in the hands of many co-designers. I use the word “co-designers” here to remind you of how I understand co-design as everything surrounding design—this process of coming up with a design. Every design has a co-design around it. I took this insight from a book written by Yanni Loukissas called Co-Designers, which I highly recommend. It’s a completely different way of looking at co-design.
In this book, and how I understand it in my thesis, co-design is the interaction between design and the process of design. It’s collaborative, but it’s also sometimes competitive—so, it’s collective design. This whole process of producing these different images, models, people, money, and calculations together is all co-design. Expansive design tries to expand the boundaries of this co-design, much like Paulo Freire’s methods expand the boundaries from the text to the context. Expansive design helps you expand from design to co-design.
In this specific lecture, I’m emphasizing visual thinking as a means, a medium, a tool, or an instrument to facilitate or complicate this expansion from design to co-design. However, in past lectures, I also presented Lego Serious Play as a tool with the same purpose, and we will see and experiment with other tools throughout this research and practice course.
I want to point out that co-design isn’t just about what happens before a building is built or before an object of design research is defined—it’s also about what happens after it’s implemented and built. Design research is never done. The Sydney Opera House has been redesigned, reframed, or reconceptualized in many different ways since it was built. Every time they create a new image, it repurposes the building. For example, at the centre of this panel, we see a protest against a war in Palestine. This war is quite old now, but the building is being used as a wall where you can host a protest that the entire world can become aware of simply because this building is so iconic.
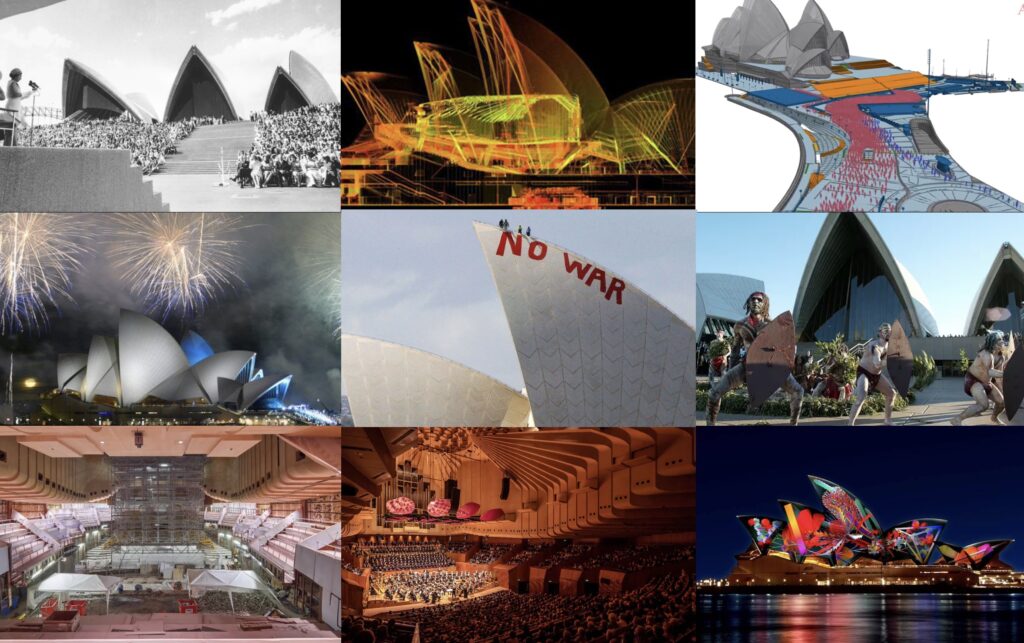
The building was never designed to be such a wall, but it’s a very creative way of reframing and rethinking the role this building plays in geopolitics. So, co-designers can still handle design objects through visual thinking. All these images you see here are trying to change something beyond themselves—they are not images for the sake of images. They are producing something else. So, they are means, mediums, tools, or instruments.
One crucial insight I got from my PhD thesis is that visual thinking helps connect individual thought to collective thought because those visuals can be shared. Sometimes, it’s hard to convey a message just using words. Sometimes, you have tacit knowledge that can’t yet be expressed in words because it’s not well articulated, but you can use visuals. And when I say visuals, I’m not just talking about drawings. As I mentioned before, visual thinking also includes spoken images. If I start talking about something, and you close your eyes and picture what I’m talking about, that’s still an image. It’s not anything I say that will evoke an image—it has to depict the overall scenario clearly, but this is still visual thinking. You can also use Lego, theater, and many other methods, but most importantly, you are connecting to someone else’s knowledge, expanding the boundaries of your understanding and learning.
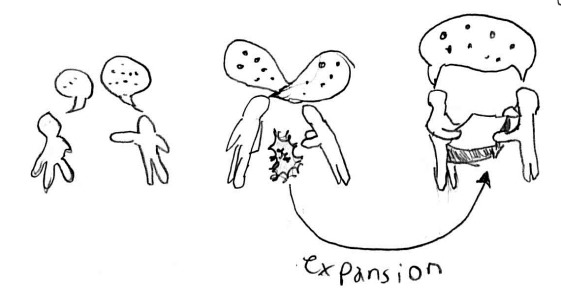
For instance, photography can be conceived in the same naive sketches I made while wrapping up my thesis. It seems simple like you have three people—each of them conceives the world in a different way—and after a while, they share and are on the same page, so to speak. They believe the design object should be like that. But unfortunately—or fortunately—this is not always so simple. There are conflicts; I was happy to find this in my research. One of my most important findings was that design does not occur in a perfect democracy of robots agreeing with each other. People have different backgrounds and interests, and when they come together, there will be friction and conflicts, but these conflicts stem from a common historical origin, not just an opinion. That’s what I call a contradiction.
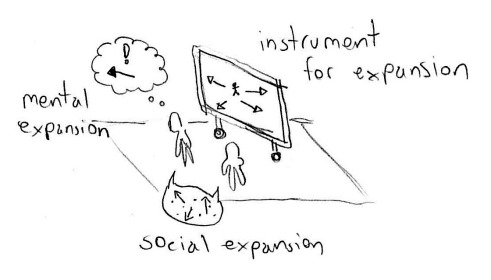
By engaging in discussion and confronting these perspectives and ideas, you can expand on the contradictions in a way that reframes them positively. Many instruments can be used to deal with contradictions. I’ve tried interactive 3D visualizations using digital boards in my PhD research, but you can also use sketches like these or Lego to display. There are many other tools I don’t even know about, but it’s up to you to research and collaborate.
These instruments are particularly useful when trying to reproduce contradictions ambiguously. If you try to reproduce a contradiction in a very realistic and precise way, you’ll probably resolve it, making it easy to understand and no longer a contradiction. Like how 1 + 1 equals 2—there’s no contradiction there. But you’d wonder what I mean if I say 1 + 1 equals 3. There’s a contradiction.
While saying this, I might want to convey that the plus sign is meaningful, too, not just the ones. The plus adds extra meaning, and then you get three. If you think graphically and are a visual thinker, you should never accept that 1 + 1 equals 2. As a graphic designer, 1 + 1 equals three graphic signs. Interesting, right? But to grasp that “equals,” you need metadesign. Think about it. You can only say what “equals” equals if you consider meta-equality.
But while discussing this, did you have this in your mind? Did you imagine this equation? I didn’t show any pictures—this is a verbal image. We all shared this, and it’s very interesting how we co-created this together because it’s not even part of my slides. That’s what I mean by visual thinking helping us move from individual knowledge because I knew this trick, but I’d never seen it before. This came out because we’re having this dialogue now. We probably never thought about 1 + 1 being read graphically, and we are co-creating this knowledge now. That’s why it’s called expansive—because we don’t even know where to go with this conversation, right? It’s always a surprise.
So, expansive visual thinking is a mode of thinking in which mental, verbal, bodily, and graphic images are produced. That’s the same definition we saw before, but there’s something new here. The purpose of expansive visual thinking is not just any kind of knowledge; it’s about unearthing contradictions in co-design. We are trying to identify what’s hampering our process and what’s bothering us, and we aim to make that into a visual image. Let’s work it out using those images.
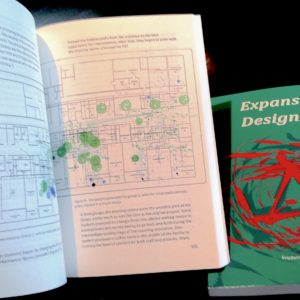
I will present three cases of using expansive visual thinking to wrap up my presentation. First of all, how I used it during my PhD. I worked with several organizations in the Netherlands to represent the contradictions of their construction projects. I want to draw attention to the last one on the bottom corner of the screen, where you see a rock representing nature and how it would be impacted by building or rebuilding a fluid barrier. In the Netherlands, they live below sea level, so they have to construct many barriers and dams around their cities, and they were renovating one of them.
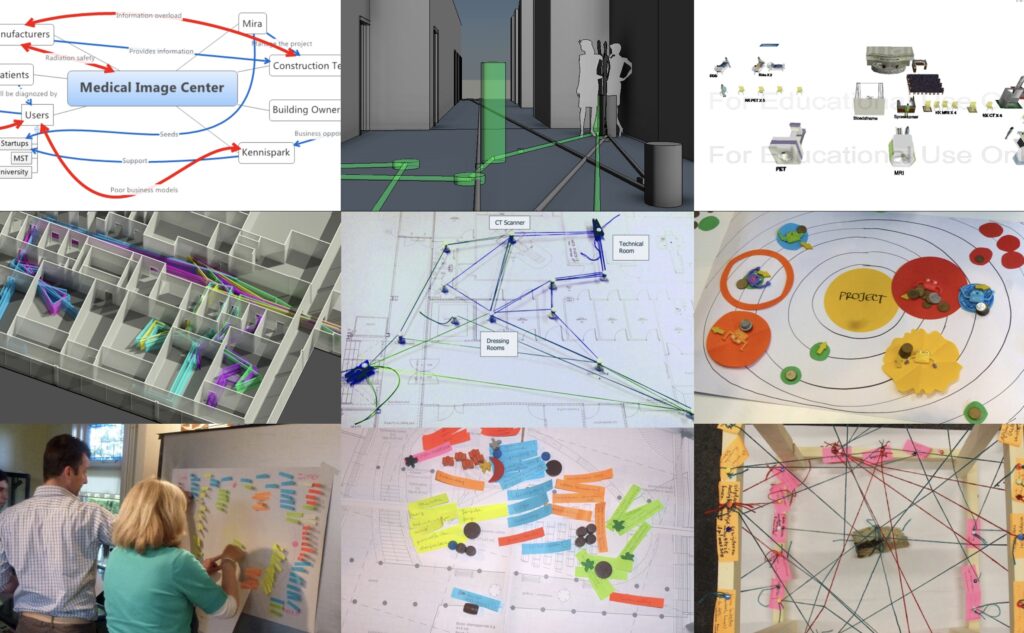
They weighed the advantages and disadvantages of having apartments on top of dams, casinos on dams, and other ways of using that land. But we thought it was essential to make the point that some of these new developments could impact nature in ways they hadn’t foreseen. That’s why, every time any design choice was proposed, they had to attach a string to the rock if there was an expected environmental impact. There was a lot of environmental impact that they hadn’t anticipated, so they had to rethink many aspects of the project. Only by visualizing it, with all the stakeholders involved, did they realize, “My gosh, we cannot go forward in the way we thought before.” Creating these images collectively, so all co-designers could reconceptualize the design object and change the project’s course, is what I witnessed in my research.
Speaking of my research process, I often used visual thinking, even for myself. You might think, “Why should I write something or make an image if I’m the only person going to look at it?” People don’t realize that you are never the same person. Every time you wake up, you’re a new person, especially year after year, you change a lot. Particularly if you’re a student acquiring new knowledge, which transforms your mental structure, you’ll see those images later and ultimately reinterpret them. Last week, we saw those Lego Serious Play model videos conceptualizing MXD from six months ago, and comparing how we see them now, students who have been here for a while thought, “Wow, is that how I saw it? I didn’t realize how much my mind had changed in these months.”
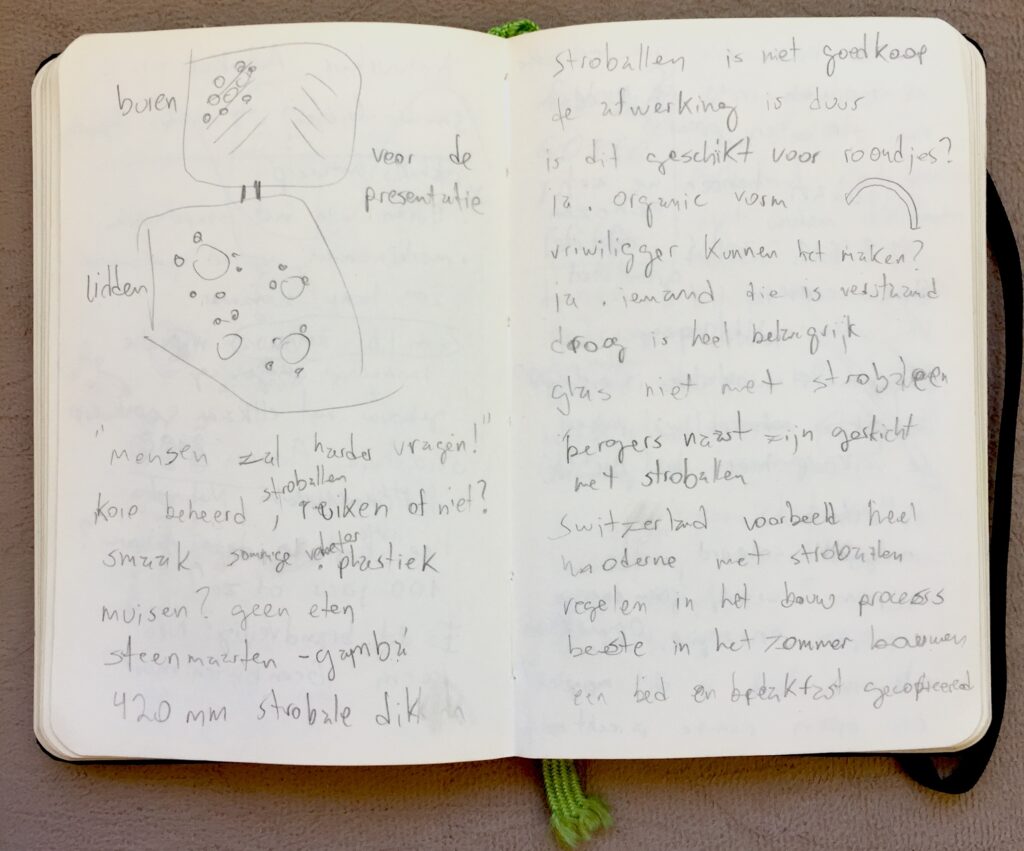
That’s why I used to make visual notes in my notebook. This notebook has much more visual thinking than the pages I’m showing now, but unfortunately, I only have this specific photo to share with you. On the left side, you can see more visual thinking. You might also notice that I’m writing in Dutch, a very hard language to learn. Making those visuals helped me anchor the meaning of what I was writing. If you’re dealing with a language that isn’t your mother tongue, making visuals helps greatly. One way I learned Dutch was by reading comic books. Yes, that’s what the Dutch people told me. They said, “Oh, you’re learning Dutch? Why don’t you buy many comic books and read them?” They have such a fun culture, right?
I attended Dutch lessons where we played games—nothing about grammar or rules. Forget about that! Just have fun with the language. I brought a bit of that Dutch culture into my design research. I try to have fun with my representations, even if I know I am making mistakes in my writing. Still, I used those representations as a way to advance my knowledge.
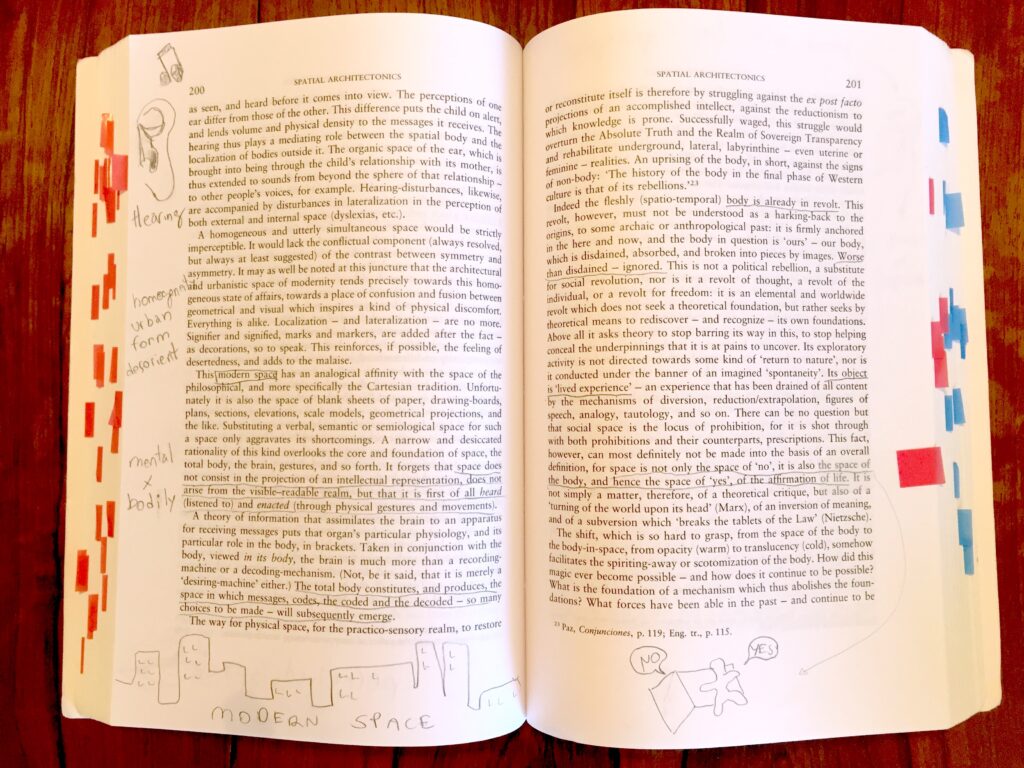
I also used visual thinking while reading. Whenever I read an article or a book, I make all kinds of representations, especially about complex theoretical concepts. I highly recommend you do the same. That’s why I ask you to print out the papers you will read and use a physical visual diary. It allows you to approach the text differently, in a less distracting way, than a digital display does. A digital display is like a world—it can absorb your attention. If an image or a message pops up, you’re completely distracted. In contrast, a physical book helps you remember where you made an annotation because you have that physical reference.
During my PhD, I read many digital and physical books, and I remember the ones I read physically much better. I quoted and cited them more in my work. So, whenever you can, use physical copies. By the way, one of the assignments we’ll discuss is called the book autopsy. You’ll have to analyze an entire physical book in a few weeks, but since the books will be from the library, you won’t be able to write in them. You can, however, use sticky notes or even transparent post-its to write on.
The second case of expansive visual thinking was the Copel+ project. This was a project I worked on with a utility company in Paraná, where I lived for the past 15 years. Hotmilk, the innovation agency of the Catholic University, helped the company communicate contradictions in the energy sector to new startup entrepreneurs. We used visual thinking strategies, including Lego Serious Play and gamestorming activities. In the end, we created video animations explaining the energy sector’s challenges. The visuals we created in our sessions were sketched out by engineers and managers, who weren’t designers or artists, but we built a common shared vocabulary. The company loved this way of working so much that they incorporated it into their innovation routines. They even bought their own Lego sets, a breakthrough for them.
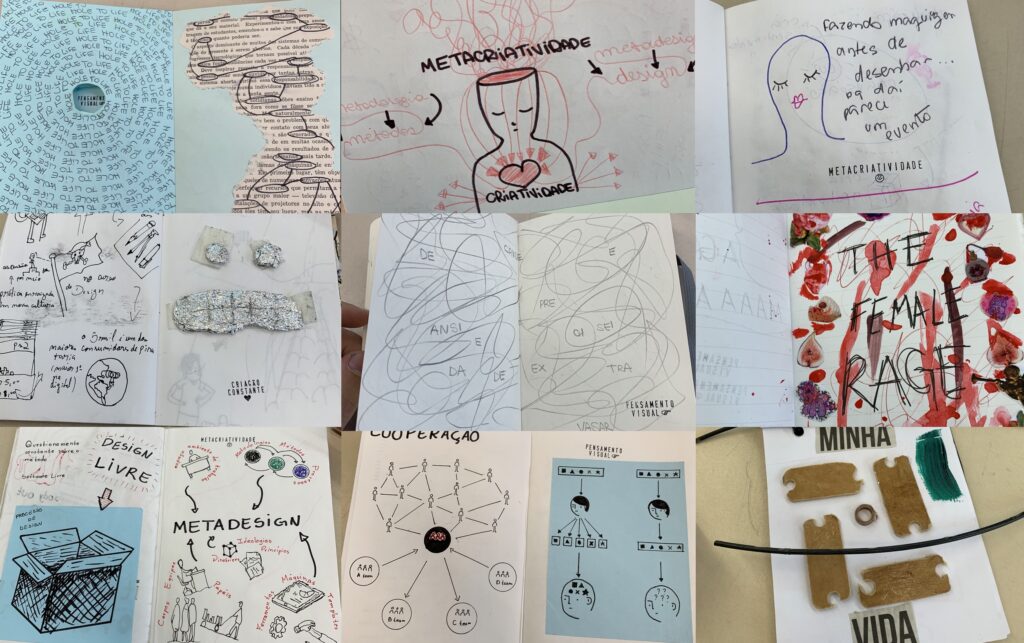
The last case involves teaching design creativity at the Federal University of Technology, Paraná. I taught this course to first-year students. They thought creativity was a recipe and said, “Hey, teach me creativity!” I told them, “I can’t teach you how to be creative. You need to experience the process, and as you go through it, you’ll learn and reflect on it.” We tried brainstorming visually, using theater, and playing board games that explored visual images. However, the most important tool for developing their visual thinking skills and creativity was the visual diaries.
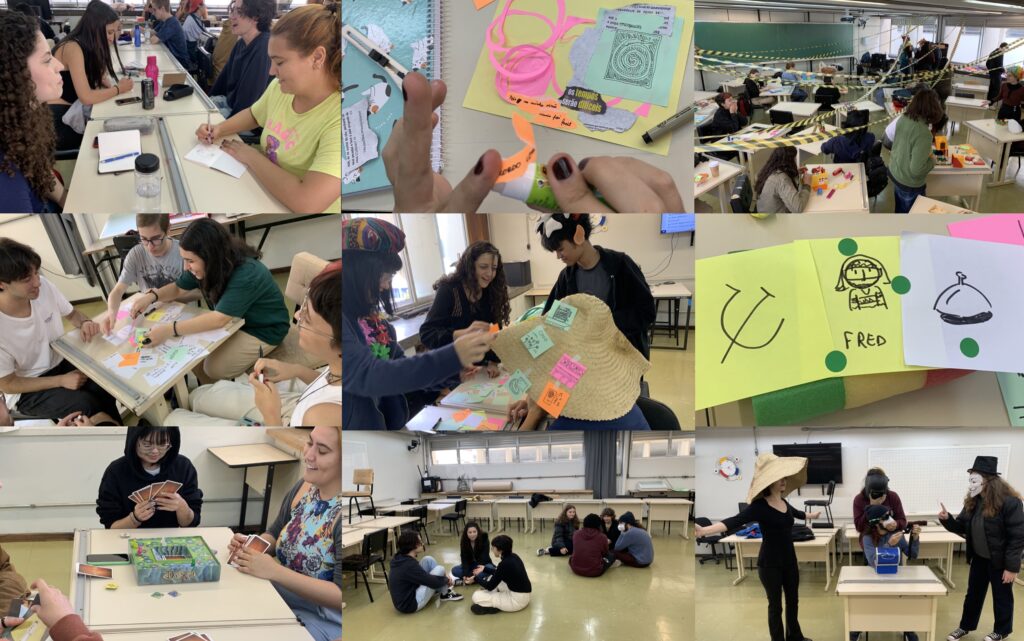
As you can see from this picture, you can imagine what I expect from you in this course. In your visual diary, you should explore how to put your ideas differently, using different materials, colors, and sketching techniques. Think about text as an image. One technique I used was a stamp to give quick feedback to students. Whenever I saw an example of visual thinking, I stamped their notebook with “Visual Thinking” or “Meta-Creativity” stamps, so they would know they were on the right track. I had to evaluate 40 students, so this was a fast way to provide feedback without taking their notebooks home for the week.
Finally, to wrap up, once contradictions are visually conceptualized, they can be understood as seeds of change rather than errors of judgment. Contradictions are not enemies; they are your friends because they announce what’s to come. What is the future to come? It’s encapsulated in contradictions, and visual thinking is a way to make that visible. You can check the references later on if you’re interested. Thank you!
References
Wielgus, M., Akiyama, K., Blackburn, L., Chan, C. K., Dexter, J., Doeleman, S. S., … & Ortiz-Leon, G. N. (2020). Monitoring the morphology of M87* in 2009–2017 with the Event Horizon Telescope. The Astrophysical Journal, 901(1), 67.
Loukissas, Y. (2012). Co-designers: cultures of computer simulation in architecture. Routledge.
Lawson, B. (2012). What designers know. Routledge.
Van Amstel, Frederick M.C. (2015) Expansive design: designing with contradictions. Doctoral thesis, University of Twente. https://doi.org/10.3990/1.9789462331846